Contact Us

Who Are the Top Tire Manufacturers in China?

China’s tire industry is large, varied, and increasingly visible in global markets. The scale is clear in vehicle production: OICA reported that China built approximately 30.2 million motor vehicles in 2023, about one-third of worldwide output. Each vehicle needs dependable tires, while replacement demand adds another major market. That scale matters.

To compare Chinese manufacturers, it helps to look beyond brand recognition. Tire Business’s annual Global Tire Report ranks companies using reported tire sales, offering a useful view of industry size. But rankings are not a complete measure of quality. They do not, by themselves, reveal how a tire performs in rain, how long its tread lasts, or how well a supplier supports overseas buyers. Those details matter on the road and in procurement.

This guide examines leading Chinese tire makers through practical signals: production capacity, international reach, product range, and investment in research and development. It also considers the limits of publicly available comparisons; company disclosures and ranking methods can differ. For readers searching “tire tires,” the goal is not to declare one universal winner. It is to make the choices easier to assess. Manufacturer claims deserve scrutiny, too. A strong shortlist should be checked against current product specifications, independent tests, and the needs of the vehicle and driving conditions.
Who Are the Top Tire Manufacturers in China?

China’s Tire Industry at a Glance: 987.75 Million Tires Produced in 2023

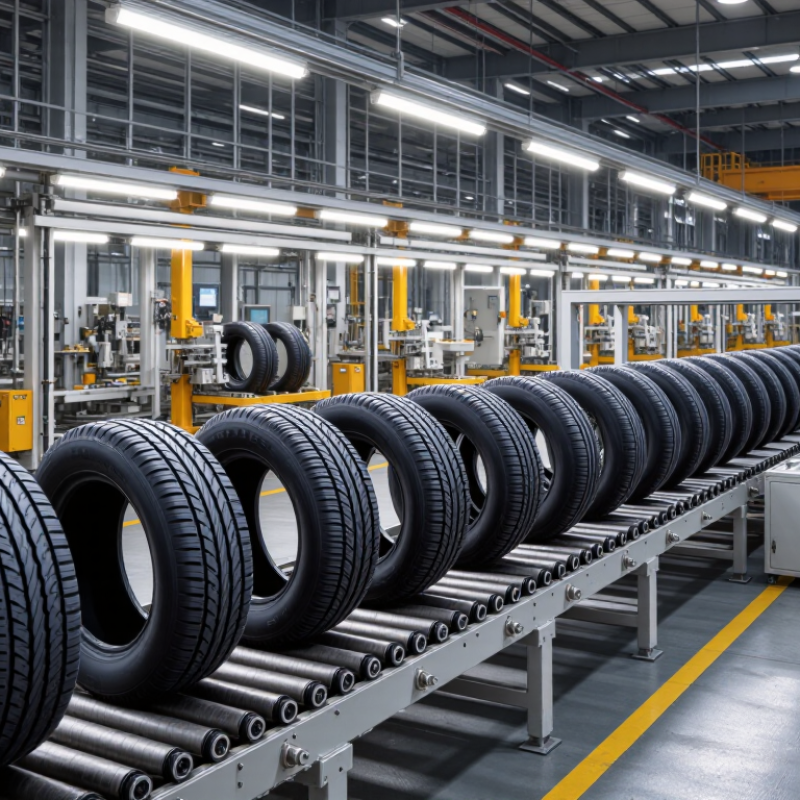
China’s tire industry produced 987.75 million tires in 2023, according to the figure in this article’s subtitle. That equals roughly 2.7 million tires per day across the year. A striking scale. Behind the number are factories running molding, curing, inspection, and packing operations across many product categories.

The total signals substantial manufacturing capacity, but it needs careful interpretation. Production is not the same as domestic sales: tires may serve replacement demand, vehicle assembly, or overseas markets. Nor does one annual total show how output is divided among passenger cars, trucks, buses, and other uses. Product mix matters, because a small passenger tire and a heavy-duty tire differ greatly in materials, weight, and manufacturing time.

For buyers and industry watchers, the headline figure is useful as a measure of scale, not a complete scorecard. It does not, by itself, reveal factory utilization, quality consistency, inventory levels, or environmental costs. Those details require separate, clearly dated data. I would also want to check the original statistical definition before comparing this total with another country’s figures. A precise number can still leave important questions unanswered.
How to Compare Leading Makers: Output, Revenue, Exports, and R&D

China’s tire sector is large, but factory output alone cannot identify its strongest manufacturers. China’s National Bureau of Statistics reported 987.75 million rubber tires produced in 2023. Treat that figure as industry context, not a company ranking. Compare each maker’s actual tire output, capacity use, and product mix; a high-volume plant may focus on lower-priced segments.

Revenue needs similar care. Tire Business’s Global Tire Report ranks manufacturers using tire-related sales, making it more useful than total corporate revenue. Check reporting year, currency, and whether figures include non-tire businesses. For exports, compare General Administration of Customs shipment data by value and volume. Rising export value can reflect higher prices, not necessarily more shipments. R&D deserves scrutiny too: look for R&D spending as a share of tire revenue, technical staff, and published testing results—not patent counts alone.

Tip: Put output, tire-only revenue, export volume, and R&D intensity in one table. Use the same year and units. That sounds simple; company disclosures are not always comparable, and this is where rankings can mislead. A practical check is to match reported production with plant capacity and export records before drawing conclusions.

China Tire Manufacturing: Annual Output

China’s reported tire output increased from approximately 856 million units in 2022 to 987.75 million in 2023. These national totals provide industry context, not a ranking of individual manufacturers; company-level comparisons of revenue, exports, and R&D require disclosures from each maker.

Source: National Bureau of Statistics of China, industrial production figures as reported for 2022–2023.

ZC Rubber and Sailun: Scale, Product Lines, and Global Footprints

China’s largest tire manufacturers compete through production scale, broad catalogs, and expanding international reach. Their factories make tires for passenger cars, light trucks, commercial fleets, and selected off-road uses. A wide product range helps serve different climates and driving conditions. Scale matters, but it does not guarantee consistent performance. The details matter.

Their product strategies can differ. One company may prioritize a large passenger-tire lineup, with sizes suited to family cars and crossovers. Another may give greater weight to truck and bus tires, where load ratings, heat resistance, and tread life are central concerns. Both approaches require careful testing. Buyers should compare specifications, warranty terms, and independent test results, rather than relying on broad claims. Product availability also varies by market.

Global footprints include export networks, local distributors, and, for some manufacturers, production facilities outside China. This can shorten delivery routes and help firms respond to regional demand. A tire designed for hot, wet roads may not suit a cold, rough route equally well. Manufacturing capacity and overseas presence are useful indicators, not complete measures of quality. Company figures change, and public disclosures may use different reporting periods. That makes direct comparisons imperfect. A little caution helps.

Linglong, Triangle, and Double Coin: OEM Supply and International Markets

China’s tire manufacturers compete on more than factory size. Original-equipment supply depends on consistent quality, delivery schedules, and tires matched to specific vehicle platforms. China produced 30.16 million vehicles in 2023, according to the China Association of Automobile Manufacturers. That scale creates a substantial domestic sourcing base, but vehicle output does not translate directly into tire orders.

International sales bring different demands. Buyers may compare product testing, available sizes, lead times, and support for replacement markets. Tire Business’s 2024 Global Tire Report tracks 75 major tire manufacturers by tire-related sales, offering a useful scale benchmark. It does not, however, show which suppliers win particular automaker contracts. Export reach can signal manufacturing capability, yet it is not proof of equal performance across every market. Details matter.

Tips: For sourcing, ask for test results tied to the intended vehicle and use. Check delivery history, not just quoted capacity. Small gaps matter. Trade data and company claims can also use different product categories, so compare like with like.

Industry Benchmarks: Tire Standards, Export Data, and EU Label Grades

Comparing tire manufacturers in China requires more than checking factory capacity. Start with the standards named in product documents. China’s GB standards set technical requirements for tires sold in the domestic market, while export products may need approvals for their destination markets. A certificate should match the exact tire type and size. It is not proof that every model from a factory performs equally well.

Export figures also need context. Customs records can show shipment value, volume, and destination, but they do not reveal product quality or long-term reliability. A rise in exports may reflect demand, pricing, or inventory changes. The comparison is imperfect. Check the reporting period and product category before drawing conclusions.

For EU-bound tires, the EU label provides comparable information on rolling resistance, wet grip, and external noise; snow or ice performance may also be indicated where applicable. Grades help narrow a shortlist, but they do not measure every real-road condition. Look at the same tire size and vehicle category when comparing labels. A quiet tire may still differ in comfort or wear. Even careful buyers can overread a single grade. Use label data alongside verified approvals, export records, and independent test results.

Who Are the Top Tire Manufacturers in China? — Industry Benchmarks: Tire Standards, Export Data, and EU Label Grades

Benchmark Area Metric Published Benchmark or Data Scope How to Interpret It Reference
China tire exports Export weight, 2023 Approximately 8.78 million metric tonnes of tire exports China’s aggregate tire exports; not a manufacturer-level figure A national total indicates export scale, but does not identify individual suppliers or establish product quality. Check the reporting source’s product coverage before comparing it with a specific HS-code series. China Customs data as reported by the China Rubber Industry Association; annual export reporting for 2023
China product standard GB 9743-2015 Passenger car tyres Passenger-car tire products covered by the standard Use the standard’s scope and applicable test requirements when checking conformity documentation. A standard reference alone does not confirm that a particular tire has been tested or certified. National Standard of the People’s Republic of China, GB 9743-2015
China product standard GB 9744-2015 Truck tyres Truck tire products covered by the standard Confirm that the product category and intended use fall within the standard’s scope, and verify current conformity documents for the specific product. National Standard of the People’s Republic of China, GB 9744-2015
EU tyre label Rolling resistance Grades A–E Tyres within the scope of EU Tyre Labelling Regulation (EU) 2020/740 Grade A represents the best performance category on this label scale; compare like-for-like tyre classes and sizes where possible. Regulation (EU) 2020/740; applicable from 1 May 2021
EU tyre label Wet grip Grades A–E Tyres within the scope of EU Tyre Labelling Regulation (EU) 2020/740 The label provides a standardized wet-grip comparison. It does not replace checks for vehicle fitment, operating conditions, or other performance characteristics. Regulation (EU) 2020/740
EU tyre label External rolling noise Noise classes A–C, with the measured value shown in dB Tyres within the scope of the EU label This is external pass-by noise, not cabin noise. Compare the displayed class and decibel value separately from rolling-resistance and wet-grip grades. Regulation (EU) 2020/740
EU tyre label Tyre category C1, C2, or C3 C1: passenger-car tyres; C2: light-commercial-vehicle tyres; C3: heavy-duty-vehicle tyres Label requirements and comparisons depend on tyre category. Confirm the category before comparing grades across products. Regulation (EU) 2020/740 and its annexes
EU winter-use marking Snow and ice symbols Applicable labels may show the 3PMSF snow-grip symbol and, where relevant, an ice-grip symbol Eligible tyre types under EU labelling rules Symbols indicate performance against specified tests; they are not a substitute for checking local seasonal rules or the tyre’s suitability for the vehicle. Regulation (EU) 2020/740

Comparison note: Export totals describe national trade, while standards and EU label grades describe product requirements or performance categories. They should not be treated as direct rankings of manufacturers. Verify the latest standard editions, market rules, and product-specific test or conformity documents before procurement.